Monitoring Code Quality using SonarQube
Contents
- What do I mean by Code Quality?
- What is SonarQube?
- Getting started
- How to use it
- Customizing the tool
What do I mean by Code Quality?
Defining code quality in general is not an easy task and I don’t intend to fully do so in this post either. I think most can agree that producing good quality code involves e.g. getting rid of unnecessary complexity, avoiding error prone constructs and abiding by best practices. There is much more to software quality than that, such as fitness for purpose and meeting non-functional requirements, but analyzing your code for the things above should help create better quality software.
I believe continuously monitoring code quality is also a good way of honoring "The Boy Scout Rule" (Clean Code, chapter 1) - leaving the code in a better state than when you found it. Or at least not in worse shape!
What is SonarQube?
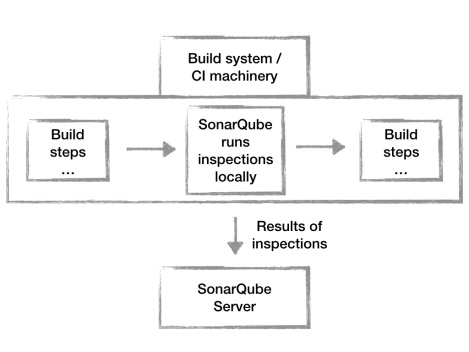
SonarQube is a tool that runs multiple quality inspection software on your code and monitors changes in them over time. It can run a whole range of software - anything from static code analysis and checking code coverage to vunerability checks and complexity analysis. It uses quality tools specific for each language such as FindBugs, PMD, Checkstyle and JaCoCo for Java. It’s all packaged in a nice monitoring overview with possibility to drill down to code level and see the issues line by line. It also contains the rationale for each rule so you can choose to ignore them or not, and you can of course add your own inspections if you’d like to.
Getting started
You can either download SonarQube or use it via Docker and you have a choice between LTS and latest version. For a local install, I’d use the latest version but for a CI install you might want to opt for the LTS version depending on your needs. For more details about the differences, see this official blog post.
My suggestion would be to try it out locally first, on your own machine using the hooks provided for your build system to get a feel for the software and what you like and don’t like before suggesting it for your entire team or organization. That way you can see what works for you and what don’t before needing acceptance from anyone else - and it should still provide value even if it’s just for you personally.
Once your SonarQube server is up and running, you can access it on http://localhost:9000/. It’s preconfigured with some default inspections, depending on the language used in your code, and can be run out of the box.
In order for it to show anything, you’ll have to analyze a project. You can use the official documentation to create hooks for running SonarQube for e.g. Maven, Gradle and Jenkins. Run it, and you should have something to look at!
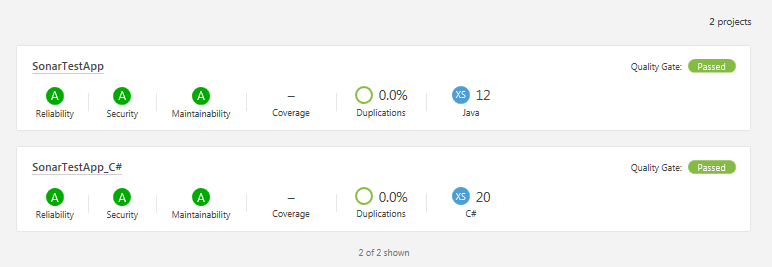
What you’ll see is something like below, a list of projects with each project having its own short overview with weighted scores indicating the overall quality of the project for a few non-functional dimensions, as well as a few important metrics. Clicking on a section will take you to the project details page, which is where the real information is.
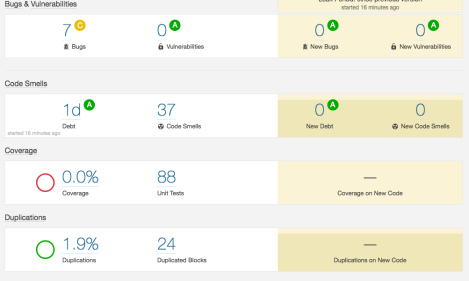
The project details not only shows more detailed metrics, but it also has a section for showing the difference from last version (in yellow), including newly introduced bugs, code smells, code coverage etc. You can also drill down even further from here to look line by line where the problems are and see the rationale behind the problem.
How to use it
In order for SonarQube to be truly useful, it should be run at least for each push to your code repository. Since it monitors changes over time, it will tell you if you’re introducing new errors or maintaing a good level.
I don’t necessarily believe in using quality as gating for commits though. There are better tools for that, such as code reviews (e.g. using Gerrit). I don’t think chasing numbers such as 100% code coverage or zero code smells does much good, on the contrary - they can be tricked and often aren’t achievable within your project constraints. This kind of tool can quickly become nothing more than a burden for developers if used incorrectly, who will then likely ignore or abandon it altogether which defeats the whole purpose of it in the first place. I do believe you can maintain good code quality through continuous monitoring of metrics though, especially when starting from scratch.
If used as a way of spotting trends or buildup of technical debt, it gives the developers an instrument to show their managers that they need to work on software quality to bring down the risk of errors. Hopefully, it will teach them a thing or two about their own coding as well at the same time.
I believe feedback loops should be as short as possible, and SonarQube has plugins to integrate directly into the IDE (for instance an IntelliJ IDEA plugin called SonarLint).
I’d also recommend that a team visualizes their SonarQube projects on a monitor or similar somewhere in the team area, as they probably would with their CI builds etc. If used properly it gives them a good overview of the current state of the software, and can become a natural way of speaking about quality and their own commitment to it.
Customizing the tool
There is an administration interface with default login admin:admin, from which you can customize what inspections to run, add new plugins, and secure your server.
You can annotate your code to avoid false positives, or you can use the administration interface on the server directly. I’d suggest the latter to avoid cluttering your code with implementation specific ignore statements, but the rationale is available via the IntelliJ plugin as well.